YouTube Trending Data Analysis
Project Background
Content Engagement and Viewer Sentiment: How audiences interact with trending content, focusing on Total Engagement Rate, Likes-to-Dislikes Ratio, and Comment Count.
Trending Dynamics and Virality: How quickly and for how long videos gain popularity, looking into View Velocity, Trending Time (Time to Trend), and Trending Retention Rate.
Category and Regional Performance: Explores content performance across different regions and categories through Category Performance, Cross-Country Reach, and Channel/Creator Performance.
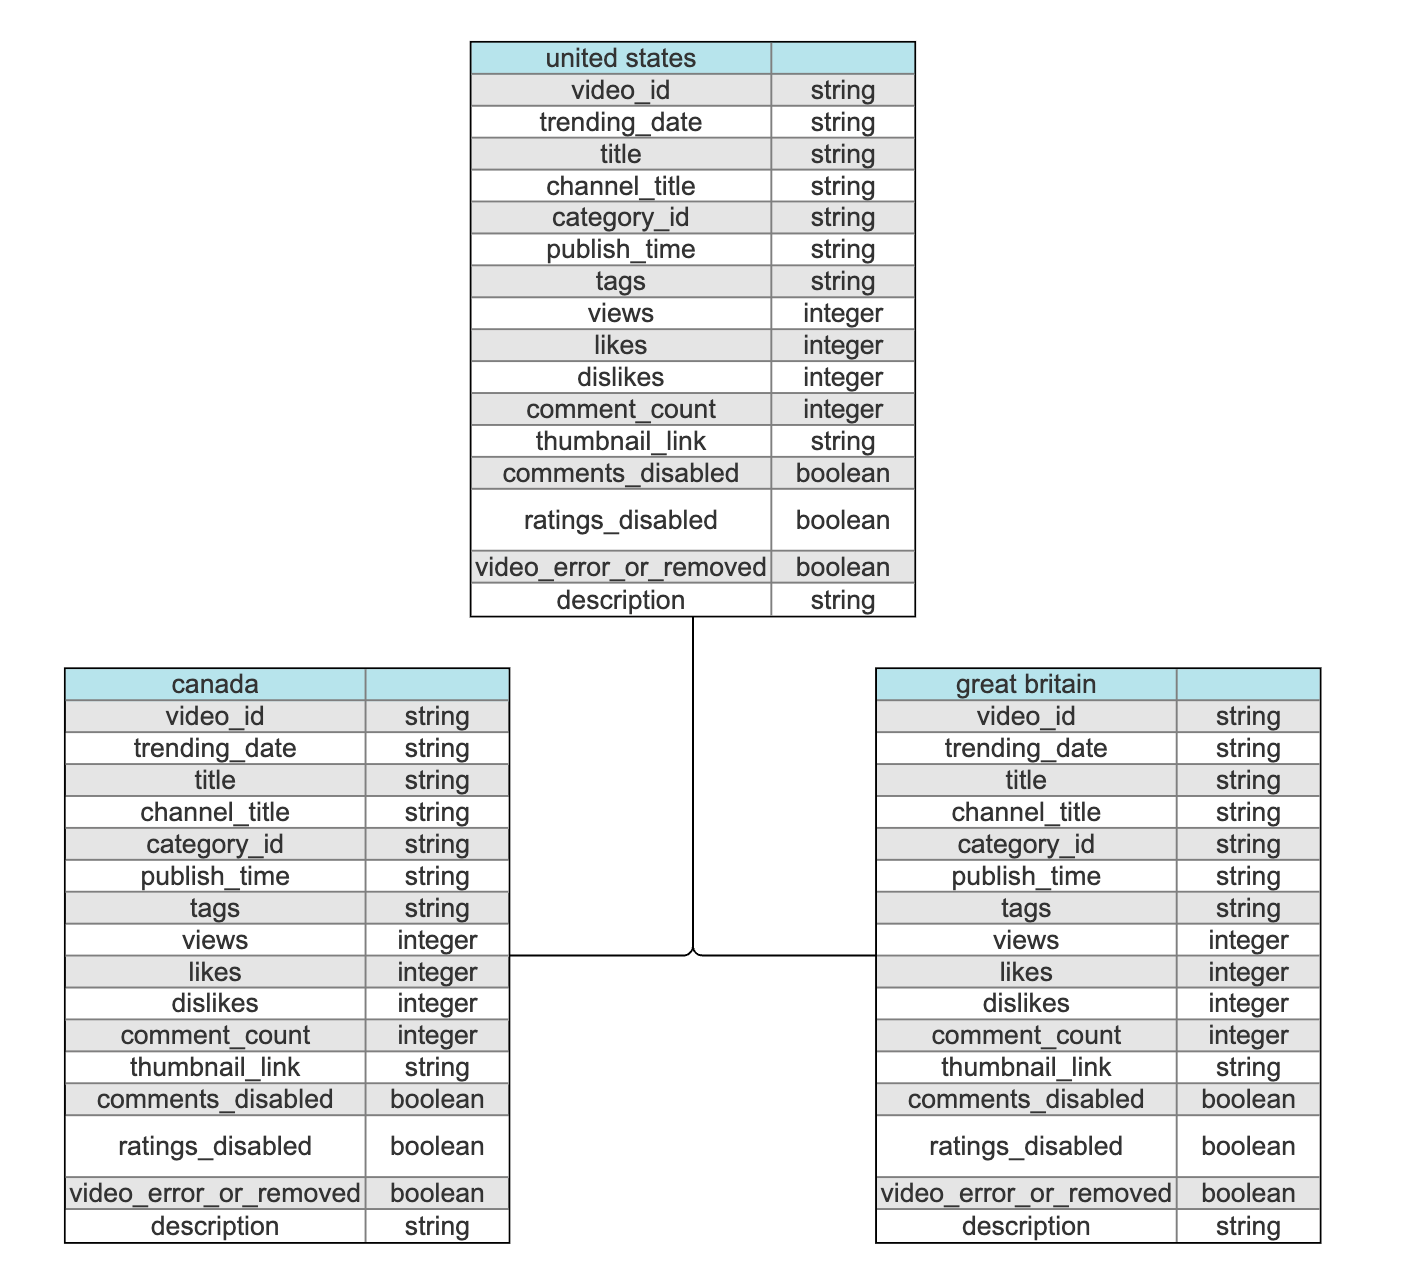
Data Structure & Initial Checks

Executive Summary
Overview of Findings
Content Engagement and Viewer Sentiment
This section focuses on how audiences interact with trending videos, emphasizing their engagement and overall sentiment:
Total Engagement Rate (TER): On average, trending videos in the Entertainment category have a TER of 12.5%, whereas videos in the Music category average 8.3%. This indicates that viewers engage more deeply with Entertainment content relative to its viewership.
Likes-to-Dislikes Ratio: Across all countries, the average Likes-to-Dislikes Ratio for trending videos is 95:1. However, categories like News and Politics see significantly lower ratios, with an average of 70:1, indicating a more polarized viewer sentiment in these areas.
Comment Count: Videos with over 500,000 views tend to have at least 10,000 comments, but in categories like Gaming, videos average closer to 7,500 comments despite higher view counts. This suggests that different genres elicit varying levels of audience interaction.
Trending Dynamics and Virality
This section dives into how quickly and for how long videos trend:
View Velocity: Videos in the Music category exhibit extremely high view velocity, gaining an average of 1.5 million views within 24 hours, compared to 500,000 views for Entertainment videos. Videos that accumulate more than 100,000 views per hour during their first day tend to stay on the trending list longer.
Trending Time (Time to Trend): On average, videos take 2.5 days to hit the trending list after publishing. However, Comedy videos take longer to trend (averaging 4 days) compared to News content, which tends to trend within 1 day due to timeliness and relevance.
Trending Retention Rate: The average retention rate for trending videos is 3.8 days, but Music videos often stay trending for as long as 7 days, while How-to videos typically trend for only 2 days. Longer retention is linked to sustained audience engagement and shareability.
Category and Regional Performance
This section analyzes how content performs across categories and regions:
Category Performance: Music dominates the trending list, making up 40% of all trending videos in the dataset, followed by Entertainment at 25%. In contrast, Education videos represent only 5% of the trending content, showing a clear gap in popularity.
Cross-Country Reach: Videos with broad appeal trend in multiple countries. For example, 10% of Music videos in the US also trend in the UK and Canada, while News videos are more localized, with only 2% of US news videos trending internationally.
Channel/Creator Performance: Channels with over 10 million subscribers contribute 60% of the trending content, while smaller creators (with fewer than 1 million subscribers) contribute only 15%. Established creators clearly dominate, although a handful of viral successes from smaller creators show potential for breaking through.
Recommendations
Based on the insights drawn from the analysis, the following recommendations can help improve content performance and audience reach:
Leverage Early Momentum for Engagement: Creators should focus on maximizing engagement within the first 24 hours post-publishing. Videos that reach 100,000 views per hour in the first day are more likely to trend for longer periods. Use strategic social media promotion, live events, and viewer engagement techniques to boost early momentum.
Diversify Content Strategies in Underperforming Categories: While Music and Entertainment dominate the trending charts, categories like Education and How-to are underrepresented, accounting for only 5% of trending videos. This represents an opportunity to develop more engaging educational content that could capitalize on untapped viewership potential.
Target Cross-Country Reach: Creators should focus on broadening their content’s appeal across different regions. Videos trending in multiple countries see up to 20% higher Total Engagement Rates. Adding subtitles, translating content, or covering universal topics could improve cross-country performance.
Prioritize Longer Trending Retention: The average Trending Retention Rate for videos is 3.8 days, but those that exceed 5 days on the list often see higher sustained growth in views and subscriptions. Creators can achieve this by producing shareable and evergreen content that remains relevant beyond its initial release.
Focus on Channels With Growth Potential: While 60% of trending videos are from channels with over 10 million subscribers, smaller creators can focus on niche markets and viral opportunities. Collaborations with larger influencers or content tailored to emerging trends can boost visibility and performance.
